
What Is Freight Rate Benchmarking? A Complete Guide for Enterprise Shippers

June 12, 2026
•
11
mins
.png)
If you are managing $20M or more in annual freight spend and your last full benchmarking exercise was at the most recent RFP, you are almost certainly running above-market rates on a portion of your portfolio right now.
The question is not whether the gap exists. It is how large it is and how quickly it can be recovered.
The answer depends on three things: whether you have transaction-based lane-level benchmark data, whether your contracted rates are structured to allow mid-cycle renegotiation, and whether the benchmarking layer connects to your invoice compliance data so you can see both problems in the same view.
This guide covers all three.
Key Takeaways
- Freight rate benchmarking is the ongoing process of measuring the gap between contracted rates and current market rates by lane and mode, so procurement teams know which rates to hold, which to challenge, and which to renegotiate before the contract term runs out.
- A VP Procurement or Director of Logistics entering a carrier renewal without current benchmark data is anchoring on the prior contract, not on what the market will now bear. Carriers benchmark shipper rates continuously. Most procurement teams do not.
- The global freight rate benchmarking market reached $1.62 billion in 2024 and is growing at 12.4% annually, driven by enterprises moving from annual RFP snapshots to continuous lane-level monitoring.
- Enterprises that shift to continuous monitoring recover 1 to 3% of freight spend through proactive renegotiation before the next RFP cycle.
- A competitive contracted rate paired with systematic fuel surcharge misapplication still produces above-market freight cost. Benchmarking and billing compliance are different problems requiring different tools. Both need to run.
What Is Freight Rate Benchmarking?
Freight rate benchmarking is how procurement teams validate that the rates locked in at the last RFP still reflect what the market will bear, lane by lane, before the next renewal gives a carrier the opportunity to close the gap.
Most enterprises benchmark their freight rates once, during the RFP cycle, and do not revisit whether those rates still reflect the market until the next annual bid.
A contract signed when truckload capacity was tight and held through a softening market means every load moving under those terms is priced above what the market would now support. T
hat gap is not visible in the ERP. It is only visible when someone runs the comparison.
Most procurement teams do not run it between RFP cycles. That is what freight rate benchmarking is for, and why doing it once a year is not enough.
How Does Freight Rate Benchmarking Fit into the Carrier Procurement Cycle?
Freight rate benchmarking fits into the carrier procurement cycle at two distinct points: as the market anchor for RFP negotiations, and as a continuous monitoring layer between sourcing events.
At the RFP phase
Without benchmark data, a procurement team evaluates carrier proposals against each other. The cheapest bid wins. With benchmark data, proposals are evaluated against market.
A bid above the DAT contract rate index for a specific van truckload corridor gets challenged regardless of where it sits relative to competing bids. A bid at market with a strong service history gets prioritized. A bid below market from an unfamiliar carrier gets investigated before award, not after.
This converts bid evaluation from a relative exercise into an absolute one, grounded in what the market is actually clearing rather than what the carrier hopes to achieve.
Between RFP cycles
Rather than waiting for the annual RFP to discover that three high-volume lanes are 12% above market, the procurement team sees the drift in real time and acts through a mini-bid or bilateral renegotiation before the gap compounds through the remaining contract term.
When benchmarking data is integrated directly into the spend analytics software, this monitoring runs continuously rather than requiring an analyst to manually pull market reports, compare them to rate cards, and build a comparison spreadsheet.
The five metrics that connect benchmarking to procurement action
How Do You Benchmark Freight Rates? A Step-by-Step Process
Freight rate benchmarking runs across five steps: build the lane inventory, select the right data source for each mode, run the rate-to-market comparison, score and prioritize renegotiation opportunities, and set a monitoring cadence to catch drift before it compounds.
Step 1: Build a complete lane inventory
List every contracted lane across every mode: origin, destination, mode, equipment type, contracted rate, contract effective date, and contract expiry date. This is the baseline the comparison runs against.
Lanes without a contracted rate on record are immediately flagged. Every lane that is being priced on a spot basis or on a verbal agreement has no anchor for a benchmark comparison and no baseline for the next RFP.
Step 2: Select the appropriate data source for each mode
Match each lane to the right benchmarking data source based on mode and corridor. Ocean lanes: Xeneta or Freightos Baltic Index. Domestic truckload: DAT RateView or FreightWaves SONAR. International air: WorldACD.
LTL and parcel: proprietary industry databases or a benchmarking platform with mode-specific datasets.
A benchmark comparison using the wrong data source for the mode produces a misleading rate-to-market ratio. The data source selection step is where most DIY benchmarking programs introduce the most error.
Step 3: Run the rate-to-market comparison
For each lane, calculate the rate-to-market ratio: contracted rate divided by the current market index for that lane, expressed as a percentage. Above 100% means above market. Below 100% means below market.
Worked example
A shipper has a contracted FTL rate of $2,650 per load on a Chicago to Dallas corridor. The DAT RateView contract rate index for the same corridor, same equipment type, shows $2,280.
Rate-to-market ratio: $2,650 ÷ $2,280 = 1.162, or 116.2%.
The contracted rate is 16.2% above the current market index. On 80 loads per month at that rate, the monthly above-market cost runs $29,600.
Over the six remaining months on the contract, that is $177,600 in freight cost running above what the market would support if the lane were renegotiated today.
That calculation, run across 150 lanes, produces a ranked list of renegotiation opportunities sorted by total dollar exposure rather than percentage deviation alone.
A 16% deviation on a low-volume lane may rank below a 6% deviation on a high-volume lane in absolute terms.
Step 4: Score and prioritize renegotiation opportunities
Rank lanes by total dollar exposure: percentage deviation from market multiplied by monthly volume multiplied by months remaining in the contract.
The top 20% of lanes by dollar exposure typically represent 70 to 80% of total above-market cost in the portfolio.
Those lanes are candidates for mini-bids, bilateral renegotiations, or carrier conversations before the next full RFP cycle. The remaining lanes can be held or monitored until renewal.
Step 5: Set a monitoring cadence
Run the comparison again on a defined schedule based on lane volatility. High-volume ocean and truckload lanes in volatile corridors: weekly or bi-weekly. Stable domestic lanes under long-term contracts: monthly. All lanes approaching renewal: daily in the 60-day window before expiry.
Monitoring without a cadence defaults to the same annual snapshot problem that makes traditional benchmarking unreliable.
When Should Freight Rate Benchmarking Be Triggered?
Freight rate benchmarking should be triggered at six specific events in addition to annual RFP cycles, because market conditions that justify renegotiation do not wait for the scheduled bid.
Before contract renewal.
Benchmark current rates to calibrate the negotiating position with market data rather than prior-year actuals. A procurement team entering a renewal without benchmarking is anchoring on the prior contract, not on what the market will now bear.
After a major capacity market shift.
When spot rates drop significantly below contract levels, benchmarking identifies the lanes with the largest active renegotiation opportunity before the window closes. Capacity softening creates temporary leverage for shippers. Benchmarking identifies exactly where that leverage is largest.
After a carrier merger or acquisition.
Consolidation changes network coverage, competitive dynamics, and often pricing. Benchmarking after a transaction confirms whether contracted rates have changed or whether new carrier economics warrant a contract review.
After a significant volume increase.
When freight volume increases materially, the shipper's leverage changes. Benchmarking quantifies the rate improvement that additional volume commitment should generate in a renegotiation conversation.
After expanding to a new lane or mode.
A lane added to the network without benchmarking is priced on the carrier's opening bid. Benchmarking before committing confirms whether the initial quote reflects market or carrier-favorable assumptions.
After a relevant index event.
When EIA diesel prices fall by more than a defined threshold, benchmarking confirms whether contracted fuel surcharge formulas have become favorable to the carrier or whether the tier structure is now producing above-market surcharge costs.
Without defined trigger events, benchmarking defaults to a reactive exercise. The next RFP arrives, the team benchmarks, and discovers how much above-market rates cost during the months the gap went undetected. By then, the recovery window for the current contract period has closed.
What Does Freight Rate Benchmarking Tell You, and What Doesn't It?
Benchmarking answers a specific, bounded question: is the contracted rate for this lane competitive against current market rates? It does not answer whether the carrier is honoring that contracted rate at the invoice level. Both questions matter, and they require different tools.
What benchmarking tells you:
- Whether the contracted rate for a lane is above or below the current market index
- Which lanes represent the highest-value renegotiation opportunities before the next RFP
- Whether a carrier's opening bid in a renewal negotiation is grounded in market reality or carrier-favorable assumptions
What benchmarking does not tell you:
- Whether the carrier is billing at the contracted rate
- Whether the accessorial cost stack is competitive at the charge-type level
- Whether a lower-rate carrier would deliver equivalent service quality on that lane
A rate that benchmarks 8% above the current market index does not mean the procurement team negotiated poorly. It may mean the contract was signed during tight capacity and the market has since corrected. But it does mean every shipment on that lane is priced above what a renegotiation would support, and the cost of waiting for the next annual RFP is 8% of lane spend multiplied by the months remaining in the contract.
How Does Freight Rate Benchmarking Compare to Freight Rate Audit?
Benchmarking compares contracted rates to market rates. Freight rate audit compares invoiced rates to contracted rates. Both are required for complete freight cost control. Operating one without the other leaves a different gap in each case.
A rate that benchmarks at market but is systematically billed with a fuel surcharge one tier above the contracted formula is still an above-market lane in practice. Benchmarking identifies the first problem. Audit identifies the second. The enterprises that close the full gap run both in the same platform so neither problem can hide behind the other.
For enterprises focused specifically on the audit and compliance layer, Freehand's freight audit and payment software runs contract-rate validation at 100% invoice coverage before payment clears.
Why Does Traditional Freight Rate Benchmarking Fall Short?
Traditional benchmarking fails for three compounding reasons: the data is stale by design, it runs once a year in a market that moves weekly, and the quality of available data varies significantly by mode.
Survey-based data introduces lag and bias
Most benchmark data is survey-based. Carriers and shippers self-report rates, which skews aggregates upward and introduces 60 to 90-day lag into a market that reprices weekly.
A benchmark confirming a rate that was accurate two months ago is not validating your contract. It is validating a market state that no longer exists.
Transaction-based benchmarks solve this. They aggregate actual paid invoice data from shippers with comparable freight profiles: no self-reporting distortion, less lag, lane-level precision.
Annual snapshots in a market that moves continuously
Container shipping prices swung 30 to 40% year-over-year on major corridors, while spot benchmarks like the Drewry World Container Index fluctuate week to week.
A contract signed in tight capacity can be above market by month six. Without continuous monitoring, that drift surfaces only at the next RFP, after it has already run for months.
Data quality varies by mode
Ocean and truckload have mature, transaction-based benchmarking infrastructure: Xeneta and Freightos Baltic Index for ocean, DAT RateView and FreightWaves SONAR for truckload.
LTL and parcel are harder. Discount structures are proprietary and not publicly indexed. Benchmarking those modes requires proprietary databases or a platform with mode-specific market intelligence built in.
For a VP of Logistics managing a multi-mode network, ocean and truckload lanes can be benchmarked with reasonably high confidence. LTL and parcel are more approximate and often require consultant access or a platform with market intelligence features built in.
See how VP of Procurement teams approach continuous carrier benchmarking at the portfolio level.
What Does Good Freight Rate Benchmarking Look Like?
A mature benchmarking program has defined coverage targets, documented trigger events, a monitoring cadence matched to lane volatility, and a direct connection between benchmark findings and procurement action. Most enterprise programs have some of these. Few have all of them.
The target state for a world-class benchmarking program:
Most enterprises are in the left column on three or more of these metrics. The financial gap between the two columns, expressed in above-market freight spend per year, is the ROI case for moving right.
What Are the Benefits of Continuous Freight Rate Benchmarking?
Continuous freight rate benchmarking produces three direct benefits that point-in-time, RFP-only benchmarking structurally cannot deliver.
Benefit 1: Proactive cost recovery before the next RFP
An industrial distributor monitoring 600-plus contracted lanes discovered that 22% of its FTL contracts had drifted more than 15% above the spot market within eight months of signing. Proactive renegotiation generated $1.4M in savings before the next scheduled sourcing event.
That recovery would not have been possible under an annual benchmarking model. The next RFP would have arrived after the above-market lanes had run for the remaining contract duration.
Benefit 2: Entering carrier negotiations with better data than the carrier has
Carriers benchmark shipper rates continuously. When a carrier initiates a renewal conversation, it already knows whether the contracted rate is below, at, or above current market.
A procurement team without continuous benchmarking enters that conversation at an information disadvantage.
A team with lane-level benchmark data knows which lanes to hold because the contracted rate is at or below market, which lanes to challenge because the contracted rate has drifted above the current index, and which concessions to make strategically rather than reactively.
Benefit 3: Validated procurement baselines for accurate savings projections
Savings targets in an RFP are meaningful only if the baseline reflects validated contracted costs at current market.
A procurement team negotiating a 5% savings from a baseline that is already 8% above market is not saving 5%. It is partially recovering a gap that continuous benchmarking would have identified and acted on months earlier.
CPOs managing carrier portfolios use continuous benchmarking data to anchor savings projections in actuals rather than prior-year rates.
Why Does Freight Rate Benchmarking Matter for Enterprise Shippers?
Freight rate benchmarking matters because contracted rates are not static, and the market does not wait for annual RFP cycles to move.
Most enterprises sign a carrier contract and assume the negotiated rate reflects market value for the contract duration. That assumption holds at signing.
It does not hold through a 12-month contract term in a market with quarterly capacity swings, index-driven fuel surcharge changes, and carrier network adjustments that reprice specific lanes mid-cycle.
The compounding cost of doing nothing
The financial consequence of operating without benchmarking is not a single visible budget overrun. It is a persistent, distributed cost premium spread across high-volume lanes that no one has compared to market since the last RFP.
A portfolio of 50 contracted lanes where 20% have drifted 10% above market represents a cost premium that compounds every week those lanes operate unreviewed.
On a $50M freight spend, that is $1M in above-market costs accumulating silently until the next RFP cycle surfaces it.
The carrier information asymmetry problem
Benchmarking also protects against a specific risk that grows as contract duration extends. Carriers use their own continuous benchmarking to identify shippers whose contracted rates have drifted below market, and time renegotiation requests to coincide with capacity tightening.
A shipper without continuous benchmarking has no data to anchor a counter-position. A shipper with it does.
CSCOs overseeing logistics networks with active benchmarking programs consistently close renewal negotiations at market rather than above it, because the carrier cannot anchor on an information gap that no longer exists.
How Does Freehand Enable Continuous Freight Rate Benchmarking?
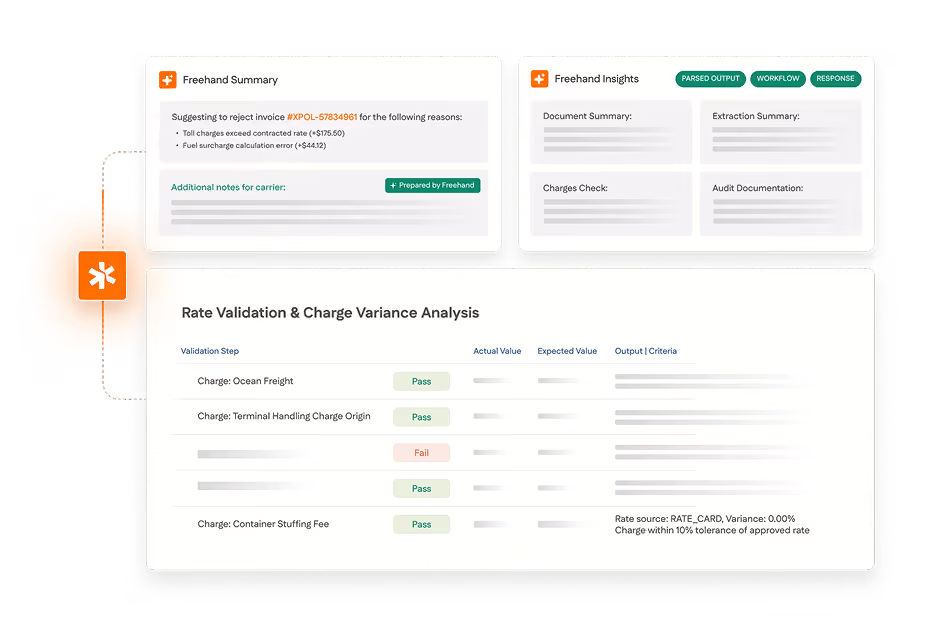
Most benchmarking programs generate a report. Freehand's carrier benchmarking platform generates a procurement decision.
The platform connects to Xeneta, DAT, SMC3, and Transporeon, running lane-level benchmark comparisons against contracted rates continuously without manual data assembly or analyst prep work.
Lanes where contracted rates have drifted above market by a configured threshold trigger procurement alerts and generate negotiation briefs automatically, pre-populated with lane-level benchmark gap versus market index, carrier billing history and audit exception patterns, volume data and contract expiry timeline, and recommended negotiation targets by lane and accessorial type.
Why the benchmarking and compliance layers need to be connected
A lane at market benchmark but with systematic fuel surcharge misapplication is still an above-market lane in practice.
Freehand makes both problems visible in a single view, connecting the sourcing and audit layers that most enterprises run as separate, disconnected systems.
The benchmarking layer connects directly to invoice compliance data in the same platform. That connection is what closes the full gap between what a procurement team negotiated and what the enterprise actually pays.
For industrial manufacturing enterprises managing large carrier portfolios across multiple modes, that single-view architecture is the operational difference between knowing where rates drifted and knowing what it actually cost.
Your contracted rates were benchmarked at RFP. The market has moved since. The only question is whether you find out now or at the next renewal, after the gap has already run for six months.
Request a demo to see what continuous benchmarking looks like across your carrier portfolio.
Frequently Asked Questions
What is freight rate benchmarking?
Comparing contracted carrier rates to current market rates by lane and mode to identify which rates are above market, which to hold, and which to renegotiate before the next RFP cycle.
What is the difference between freight rate benchmarking and a freight audit?
Benchmarking checks if contracted rates are competitive vs. the market. Audit checks if the carrier is billing at the contracted rate. Both gaps cost money. Both need to run.
What is rate drift in freight benchmarking?
The widening gap between a contracted rate and the current market index after signing. Capacity softening post-award can push a competitive rate above market within months. Tracking drift by lane identifies early renegotiation candidates.
How often should enterprise shippers benchmark freight rates?
Continuously for high-volume and volatile lanes. Monthly for stable domestic contracts. Every lane in the 60-day window before renewal. Annual benchmarking at RFP alone misses months of above-market cost.
What is a rate-to-market ratio?
Contracted rate divided by the current market index for that lane, expressed as a percentage. Above 100% means above market. Tracked by lane across the carrier portfolio, it shows exactly where renegotiation opportunity sits.
Every warehouse. Every provider. Every mile.
Gartner's 2026 outlook on logistics outsourcing, and how AI Teams hold every contract to the terms you agreed.
- Where outsourced logistics quietly loses margin
- Why billed charges drift from the contract
- How AI Teams close the gap