
What Spend Intelligence Looks Like Below the Total Line

April 17, 2026
•
7
mins

Total freight spend is a number. Lane-level spend by carrier by mode is intelligence. The distance between them is a sourcing strategy.
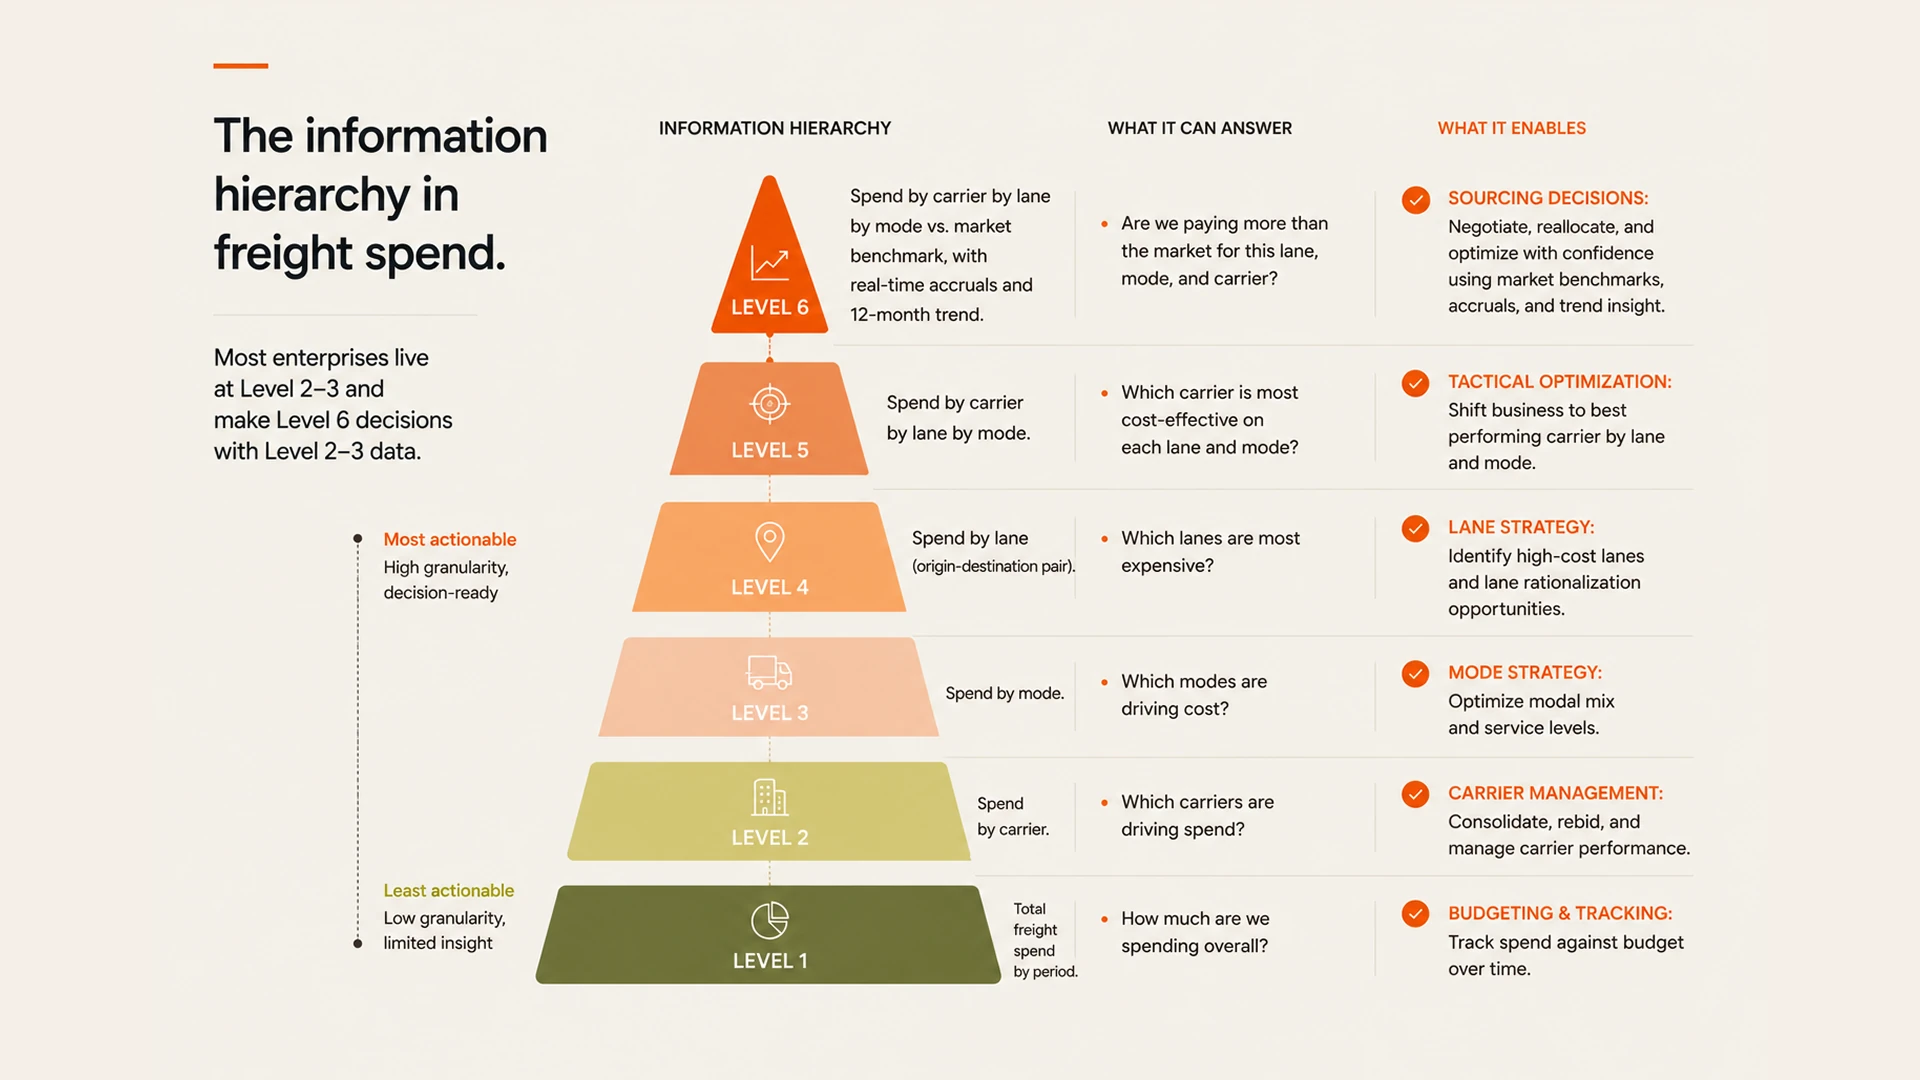
A freight budget tells you how much you spent. Freight spend intelligence tells you why you spent it, whether you should have, and what to do differently next cycle. Most enterprises have the first. They operate without the second.
The gap is not about data availability. The invoices exist. The carrier records exist. The shipment data exists. The gap is about granularity and the infrastructure to maintain it in real time. Total freight spend at the carrier level is achievable with a basic data pull. Cost per lane, per mode, per carrier, per shipment type, with real-time accruals and benchmarked against market rates — that requires a data architecture that most freight operations have not built.
What the total line obscures
A logistics director who knows that total freight spend is $85 million annually knows very little that is actionable. They cannot answer the sourcing question — which lanes are overpriced relative to the market, and which carriers are performing at contracted rates? They cannot answer the allocation question — which business units or product lines are driving freight cost above budget, and is that a volume problem or a rate problem? They cannot answer the mode question — is the air freight share appropriately sized for the speed requirements, or is premium mode usage being driven by demand patterns that could be changed with better planning?
These questions are not exotic. They are standard freight management questions. The reason they go unanswered is not that the data does not exist to answer them. It is that assembling the data into a form that answers them, at the granularity required, on a current rather than historical basis, has been treated as a reporting project that sits perpetually on the roadmap.
Lane-level intelligence as the minimum viable unit
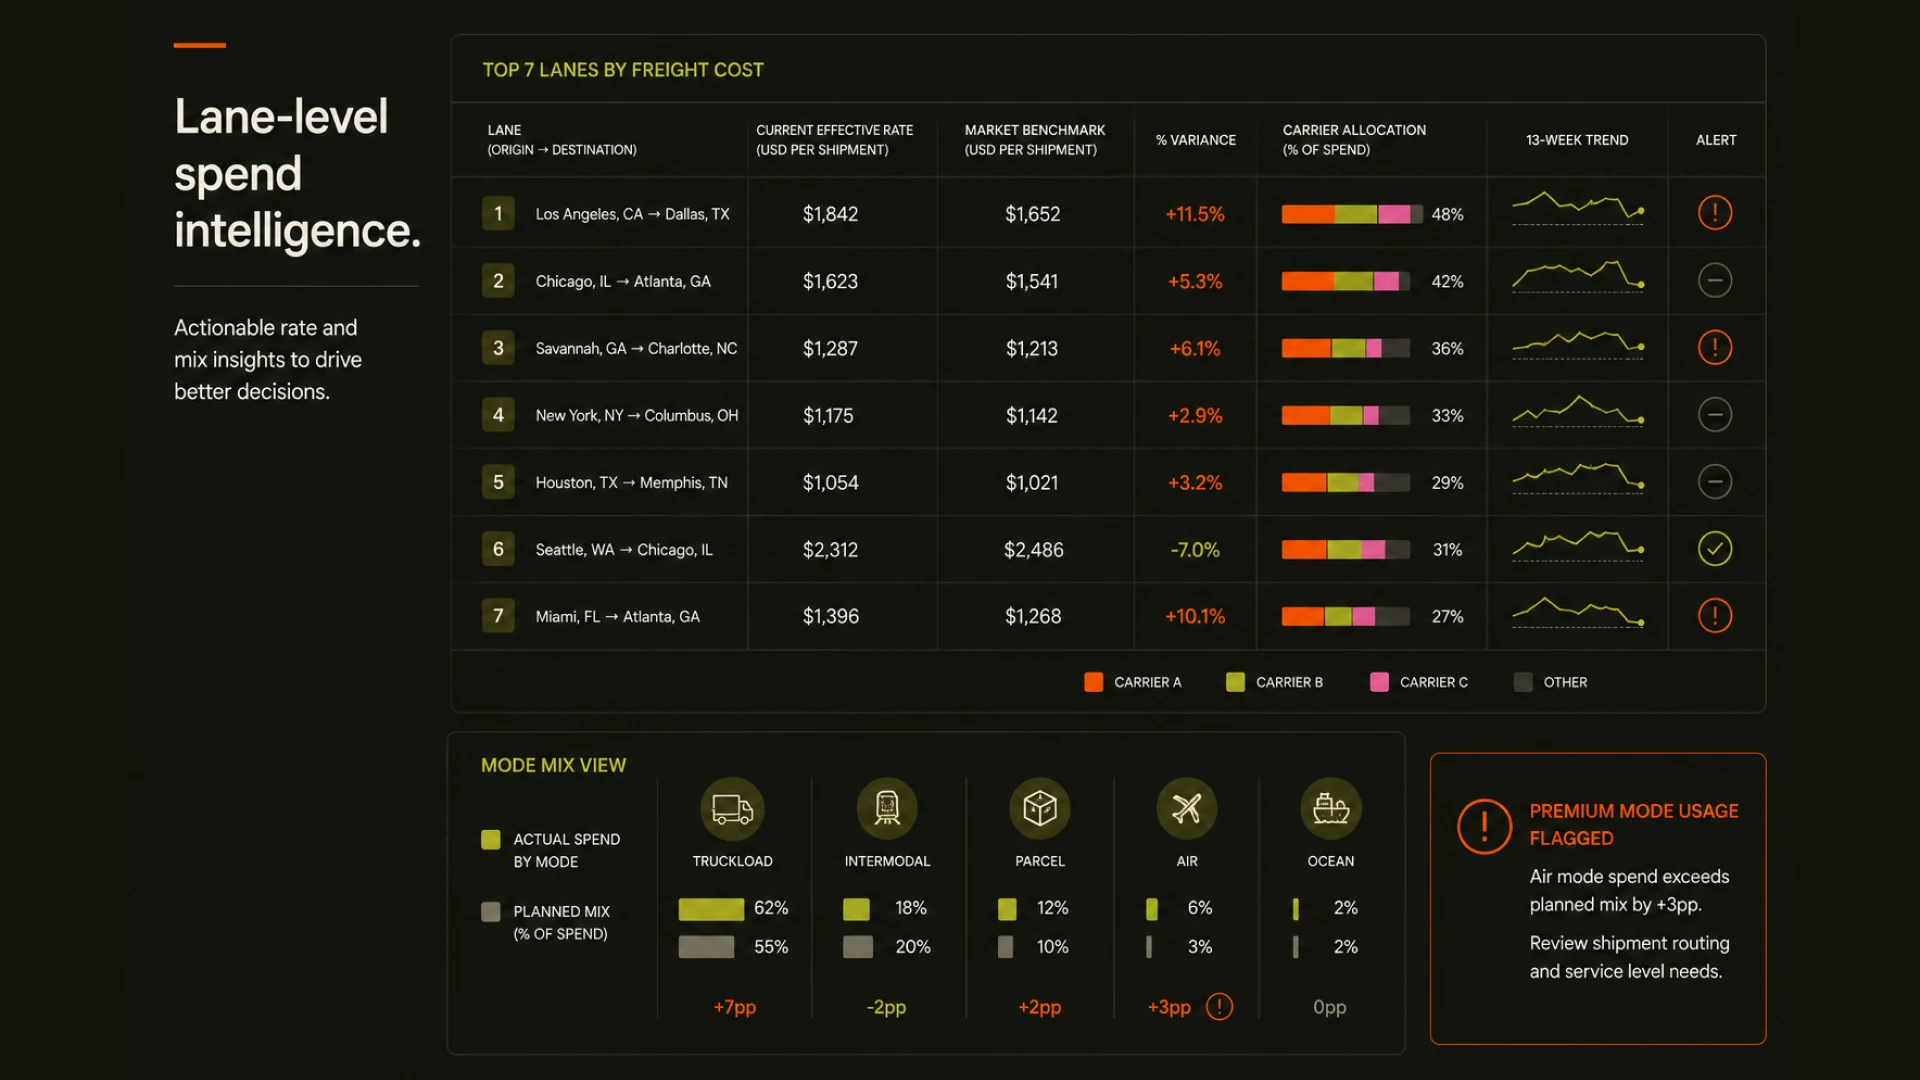
Lane-level spend — cost per origin-destination pair, broken down by mode and carrier — is the minimum granularity at which freight spend becomes actionable for sourcing purposes. A lane that is 18% above the market benchmark on a carrier the company has been using for three years is a specific, addressable opportunity. A total spend number that is 3% above budget is a problem without a handle.
The companies that have built lane-level spend intelligence typically discover two things when they look at it for the first time. First, the spend distribution across lanes is more concentrated than expected — a small number of high-volume lanes represent a disproportionate share of total freight cost, and those lanes have not necessarily received proportional sourcing attention. Second, the rate variance across carriers on the same lane is larger than anyone suspected — carriers who nominally serve the same lane often have significantly different effective rates when accessorials and fuel surcharges are factored in.
“The first time a logistics team sees lane-level spend benchmarked against the market, they usually find that their two or three highest-cost lanes were not on anyone's radar.”
Real-time versus historical
Lane-level spend intelligence that runs on a quarterly data extract is useful for planning but not for operational decision-making. The carrier whose rate is 12% above the market benchmark in a quarterly report may have had that rate for six months before the report surfaced it. The sourcing action that the report prompted may take another six weeks to execute. The effective rate paid over the full nine-month window was higher than it needed to be.
Real-time spend intelligence — lane-level accruals updating as shipments tender and invoices arrive, benchmarked against current market rates from DAT, Xeneta, and FreightWaves — changes the decision cadence. Procurement teams that have access to this see carrier rate drift as it happens rather than discovering it in a quarterly review. A carrier whose effective rate crosses the market benchmark threshold triggers an alert rather than appearing in a report three months later.