
Real-Time Logistics Analytics: How It Works
Real-time logistics analytics turns live freight and invoice data into immediate action. Learn how it works, what it catches, and how to evaluate one.
.webp)
August 18, 2026
•
16
mins
Real-time logistics analytics is the continuous processing of freight and invoice data as it happens, instead of waiting for a scheduled report. It turns a rate change or a cost spike into an alert within hours, not a line item you notice at month-end. That speed gap is where most preventable freight cost sits.
Key Takeaways
- Real-time logistics analytics processes freight and invoice data continuously, as it arrives, so a cost problem shows up as an alert instead of a surprise on next month's report.
- The delay in periodic reporting has a real cost. On $30M in freight spend, an undetected rate drift can cost $50,000 or more in just one billing cycle.
- It runs on data most companies already have: carrier invoices, TMS records, and ERP feeds, pulled in continuously instead of on a schedule.
- A Fortune 500 CPG company's CFO used continuous benchmarking to surface $6.8M in performance gaps before its next board review, not after.
- Evaluating a platform means checking data latency, integration depth, and what happens after an alert fires, not just whether a dashboard updates fast.
What is real-time logistics analytics?
Real-time logistics analytics is the practice of processing freight, shipment, and invoice data continuously as it is generated, rather than compiling it into a report on a fixed schedule. The output is not a prettier dashboard. It is a shorter gap between something going wrong and someone finding out.
This is a different thing from real-time visibility, even though the two get used interchangeably. Visibility tells you where a shipment is right now. Analytics tells you whether the cost, rate, or billing pattern behind that shipment is behaving the way it should, and flags it the moment it is not.
It is also a different thing from logistics intelligence, which is the layer above analytics: turning what an alert catches into a specific carrier, lane, or contract decision, not just catching the anomaly itself. For the broader definition this piece builds on, see our guide to real-time logistics.
Why does the reporting delay actually cost you money?
The reporting delay costs money because a problem that exists for 30 days before anyone sees it has already happened 30 days' worth of times. A carrier rate drift, a billing pattern break, or a cost spike does not pause and wait for the next quarterly review. It repeats on every shipment until someone catches it.
On $30M in annual freight spend, even a small, undetected rate drift, the kind that would show up as a rounding error on a monthly report, can cost $50,000 or more by the time a periodic report surfaces it. Freehand's own analysis of lane-level spend intelligence goes deeper into why a quarterly data extract is useful for planning but not for catching a problem while it is still small.
{{blue-cta}}How does real-time logistics analytics actually work?
Real-time logistics analytics works by pulling in data continuously from the systems you already run, then checking each new record against a baseline the moment it lands. Three layers make this happen.
The first layer is continuous ingestion. Carrier invoices, TMS records, and ERP data flow in as they are created, not as a nightly or weekly export. The second layer is comparison against a live baseline. Contracted rates, past patterns, and market benchmarks get checked against every new record right away, not against last quarter's average. The third layer is the alert itself, routed to the right person right away, not buried in a report nobody opens until the numbers are already old.
Batch reporting can use the same data. What it cannot do is shrink the gap between the event and the alert down to hours instead of weeks.
What can real-time analytics catch that periodic reporting misses?
Real-time analytics catches cost problems while they are still cheap to fix, not after they have compounded across every shipment in a reporting period. Four patterns show up most often in freight and invoice data specifically.
- Rate drift: a contracted rate that has quietly moved off the agreed number, caught on the next invoice instead of the next quarterly audit.
- Cost spikes: a sudden jump in spend on a lane or carrier, flagged the same week it starts, not discovered in a month-end variance report.
- Billing pattern breaks: a carrier that starts billing a charge type differently than it has historically, a signal a periodic sample is likely to miss entirely.
- Contract anomalies: a charge that falls outside the terms of the agreement, caught at the invoice level instead of surfacing as an aggregate discrepancy later.
What are the benefits of real-time logistics analytics?
The core benefit is time. Every other gain follows from closing the gap between an event and the moment someone can act on it.
- Faster decisions: a rate drift or cost spike reaches the right person the same week, not the same quarter.
- Fewer month-end surprises: problems get caught and fixed before they show up as a variance someone has to explain at close.
- Stronger negotiating position: continuous data on carrier behavior going into the next contract, instead of a stale snapshot from months ago.
- Less reliance on sampling: continuous processing can cover every invoice, instead of the partial sample most manual and periodic reviews settle for.
- Audit-ready data: a continuous record of what happened and when replaces a scramble to reconstruct history when someone asks a question.
How did logistics reporting work before real-time analytics?
Before real-time analytics, most companies ran freight and invoice reporting on a fixed schedule: a monthly or quarterly export from the TMS and ERP, reconciled by hand in a spreadsheet, then reviewed once it was compiled. Sampling was often the only realistic option, since checking everything by hand did not scale past a certain invoice volume.
That model was not careless. It reflected the tools available at the time. The problem is that a rate drift or a billing pattern break does not wait for the next export. It repeats on every shipment in between, and the periodic model has no way to catch it until the numbers are already old.
How does real-time analytics compare to periodic reporting?
Real-time analytics and periodic reporting differ mainly in when you see a problem, and how much it has already cost by then. The table below shows the difference.
| Dimension | Periodic reporting | Real-time analytics |
|---|---|---|
| Data freshness | Updated on a fixed schedule, often monthly or quarterly | Updated continuously as new data arrives |
| Detection speed | Days to weeks after the event | Hours after the event |
| Action window | Problem has often already repeated across a full cycle | Caught before it compounds further |
| Typical output | A static report reviewed after the fact | An alert routed to someone who can act on it |
What does a worked example of catching a gap in real time actually look like?
A real example makes the dollar impact concrete. A Fortune 500 CPG company's CFO needed to see performance gaps before the next board review, not after it.
The company used Freehand's Benchmarking Agent to compare its freight cost per unit, audit exception rates, and payment cycle time against current market data, all the time. That ongoing comparison surfaced $6.8M in gaps worth acting on, ranked by dollar value, with time to fix them before the board saw the numbers. Freehand provides that comparison continuously, not as a one-time exercise ahead of a single meeting.
What should you evaluate in a real-time logistics analytics platform?
Check how fresh the data really is, how deep the integration goes, and what happens once an alert fires. A platform that updates every hour but only ingests half your invoices is not solving the problem it claims to.
- Data latency: how much time passes between an event and it showing up in the system, not just how often the dashboard refreshes.
- Integration depth: whether the platform pulls straight from your TMS, ERP, and invoices, or needs a manual export step that brings the delay right back.
- Alert routing: whether a flagged anomaly reaches someone who can act on it right away, or sits in a queue until someone checks.
- Coverage breadth: whether every invoice and shipment feeds the system, or just a sample. A gap in coverage is a gap in what it can ever catch.
What are the major challenges in managing real-time logistics data?
The benefits above only show up once the underlying data problems get solved, and those problems are where most real-time analytics rollouts actually stall.
- Data silos: freight spend sits split across a TMS, an ERP, and a stack of carrier invoices, each telling a different piece of the same story.
- Format and quality inconsistency: one carrier sends EDI, another sends PDF, a third sends CSV, and vendor names rarely match across systems without normalization.
- Integration complexity: connecting a legacy ERP like SAP or Oracle to a continuous feed usually means custom coding, not a settings toggle.
- Alert fatigue: a poorly tuned baseline floods the team with false positives, and real flags start getting ignored along with the noise.
- Coverage versus headcount: getting to full, continuous coverage without needing a bigger team to review what it finds is the tradeoff most platforms never actually solve.
What technologies power real-time logistics analytics?
Three technology layers do the real work here, and none of them need new hardware for freight cost and invoice analytics. The first is continuous data pipelines: API and EDI connections to your TMS, ERP, and carrier invoice feeds, replacing the nightly or weekly export with a steady stream of records as they get created.
The second layer is AI and machine learning. These models match each new record against contracted rates, past patterns, and market benchmarks, then flag whatever falls outside the expected range. The third layer is alerting and routing. It takes a flagged variance and gets it to the person who can act on it, instead of leaving it in a report nobody opens.
How do you implement real-time logistics analytics?
You implement it by connecting your data sources first, then setting baselines, then narrowing in on the alerts that actually matter. Trying to do all three at once is the most common reason a rollout stalls.
- Connect the data sources: link your TMS, ERP, and carrier invoice feeds directly, not through a manual export step that reintroduces the delay you are trying to remove.
- Set your baselines: load contracted rates, historical patterns, and the market benchmarks you want new records compared against.
- Define what triggers an alert: a rate that drifts by more than a set percentage, a cost spike on a lane, a billing pattern that breaks from history.
- Start narrow, then expand: pilot on one carrier, lane, or spend category, confirm the alerts are catching real problems, then widen to full invoice coverage.
What's next for real-time logistics analytics?
The direction is toward less manual review, not more dashboards to check. Continuous monitoring already moved the industry past the fixed reporting schedule. The next step is systems that resolve the exception they find, instead of just surfacing it for someone to work by hand.
That shift matters most in freight cost and invoice data. Record volume makes manual review of every flag impractical past a certain spend level. An alert that resolves itself, with a person reviewing only the edge cases, closes the loop real-time analytics opened in the first place.
Real-time only matters if it changes what happens next
A faster dashboard does not fix anything by itself. The value of real-time logistics analytics sits entirely in the gap it closes between an event and someone acting on it. That gap only closes if the alert actually reaches someone, and gets resolved.
Freehand's Spend Intelligence Agent pulls freight spend from every system into one view, updated all the time, and gives your team a single source to work from instead of five disconnected exports. The Anomaly Detection Agent watches that spend around the clock and equips finance with an alert the moment a cost spike, rate change, or billing pattern break shows up, not at month-end. Together they turn real-time data into a real-time response, on a spend analytics layer that already has full audit coverage underneath it. Freehand helps you act on that data the same week it arrives, not the same quarter.
{{brown-cta}}
Frequently Asked Questions
What is the difference between real-time logistics analytics and real-time visibility?
Visibility tells you where a shipment is right now. Analytics tells you whether the cost, rate, or billing pattern behind that shipment is behaving normally, and flags it the moment it isn't. The two often get bundled together, but they answer different questions.
What are the main benefits of real-time analytics in logistics?
Real-time analytics in logistics catches a cost problem while it is still small, before it repeats across a full reporting cycle. It also brings faster exception handling, cleaner data for negotiations, and fewer surprises at month-end close.
Does real-time logistics analytics require IoT sensors or telematics?
Real-time logistics analytics does not require IoT sensors or telematics for freight cost and invoice analytics specifically. Those track physical shipments. Cost analytics runs on carrier invoices, TMS records, and ERP data, which most companies already generate all the time.
Is real-time logistics analytics only useful for very large enterprises?
Real-time logistics analytics matters most where the dollar exposure from a reporting delay is large enough to notice, which usually means $15M or more in annual freight spend. Below that threshold, the same undetected rate drift costs less in absolute terms, though the underlying problem is identical.
How is real-time analytics different from a real-time dashboard?
A dashboard that refreshes quickly is not the same as analytics that acts on the data. A dashboard shows you the number. Real-time analytics compares that number against a baseline continuously and flags it the moment something is off, whether or not anyone is looking at the dashboard.
Is shipping analytics the same as real-time logistics analytics?
"Shipping analytics" usually refers to parcel and e-commerce carrier performance, delivery times, and post-purchase tracking data. Real-time logistics analytics, as covered here, is scoped to enterprise freight cost and invoice data: rate drift, cost spikes, and billing pattern breaks across LTL, FTL, and freight carriers, not parcel delivery performance.
Every New Invoice Checked Against Your Baseline the Moment It Lands.
Freehand compares every invoice to your contracted rates continuously, so a drift gets flagged the same week it starts, not the same quarter.
By the Time the Report Runs, the Rate Has Already Drifted a Month's Worth of Invoices.
A periodic export catches a rate drift once it's already repeated on every shipment since the last one.
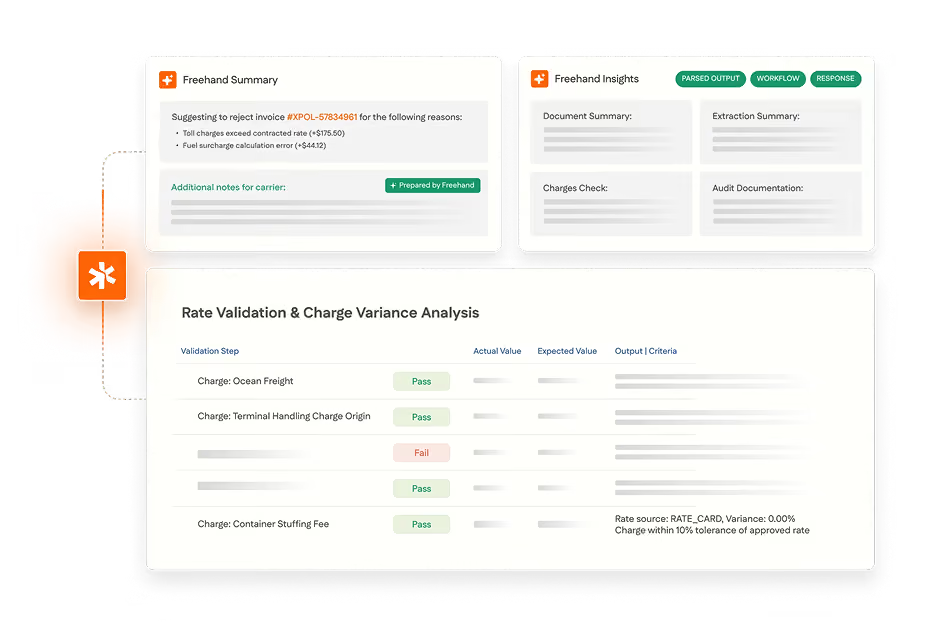
Every warehouse. Every provider. Every mile.
Gartner's 2026 outlook on logistics outsourcing, and how AI Teams hold every contract to the terms you agreed.
- Where outsourced logistics quietly loses margin
- Why billed charges drift from the contract
- How AI Teams close the gap