

Best Carrier Benchmarking Tools: 8 Compared
.webp)
July 15, 2026
•
11
mins
Comparing the top carrier benchmarking tools for 2026: 1. Xeneta, 2. Freehand, 3. DAT iQ, 4. FreightWaves SONAR, 5. Freightos Terminal, 6. Transporeon, 7. CLX LaneLogix, 8. Cass Transportation Benchmarking.
Quick answer: For the broadest independent market-rate database to benchmark carrier rates against, Xeneta leads on ocean and air, DAT iQ on North American truckload, and SONAR on multimodal market data. Freehand is the pick when you want to benchmark your actual audited spend against the market and act on the gaps automatically, rather than buy a data subscription and compare by hand.
Benchmarking a carrier rate only helps if you know what the rest of the market is paying, and whether your own invoices actually match your contract. Most teams solve the first half with a market-data subscription, then still compare lane by lane in spreadsheets and rarely revisit it once the bid is done.
The tools below split into two groups. Independent rate-data platforms give you the market number to benchmark against. One, Freehand, benchmarks your real paid rates against the market and acts on the gaps it finds. The right pick depends on which half of the problem is costing you money.
TL;DR: the best carrier benchmarking tools at a glance
- Xeneta: the leading independent ocean and air rate benchmarking platform, with rates paid by 700+ global shippers across 160,000+ lanes.
- Freehand: benchmarks your actual audited invoices against the market and flags the lanes drifting above rate, then acts, rather than handing you a dataset to compare by hand.
- DAT iQ: the deepest North American truckload benchmarking, built on paid transactions from 1,300+ shippers.
- FreightWaves SONAR: multimodal market intelligence with real-time data across truck, rail, ocean, and air.
- Freightos Terminal: index-grade ocean and air rate data, home of the CME-traded Freightos Baltic Index.
- Transporeon: rate benchmarking on top of one of the largest carrier networks, strongest in Europe.
- CLX LaneLogix: lane rate benchmarking with bid management and scenario modeling for truckload strategy.
- Cass Transportation Benchmarking: benchmarking drawn from Cass's audited freight-payment dataset.
What are carrier benchmarking tools?
Carrier benchmarking tools compare your carrier rates and service performance against the wider market, so you can tell whether a lane is priced above market and where to act. They typically:
- Benchmark contracted and spot rates against market data by lane and mode
- Score carrier performance on cost, on-time delivery, and claims
- Surface lanes and accessorials drifting above market
- Track rate trends, capacity, and seasonality over time
- Feed target rates into bids and negotiations
- Report cost and service by carrier, lane, and business unit
Most tools give you the market number and leave the comparison to you. A smaller set, including spend analytics software with agentic AI, benchmarks your actual invoices and acts on the gaps.
How We Evaluated Carrier Benchmarking Tools
We judged every platform on the same cross-cutting criteria using vendor documentation, G2, and Gartner Peer Insights. Market-rate data breadth carries the most weight, because the core job of a benchmarking tool is telling you what the rest of the market pays, followed by whether the tool benchmarks your own spend and acts on what it finds.
- Market rate data breadth and independence (25%). Size, independence, and lane coverage of the underlying rate database.
- Benchmarking from your actual spend (20%). Whether it benchmarks your real paid invoices, not just shows market data to compare by hand.
- Action and autonomy on the gaps (15%). Whether it acts on above-market lanes (flags, feeds negotiation, recovers) or only reports.
- Mode and geographic coverage (15%). Ocean, air, road, and parcel across the regions you ship.
- Data freshness and update cadence (10%). Real-time or daily versus periodic updates.
- Integration and time-to-value (15%). ERP and TMS fit and speed to a usable benchmark.
This is an independent editorial comparison referencing Gartner and G2 alongside vendor documentation; it is not a certified third-party ranking.
Best carrier benchmarking tools, ranked for 2026
The independent rate-data platforms lead on the core job: telling you what the market pays. Xeneta sits first on breadth and independence. Freehand sits second as the tool that benchmarks your actual spend against that market and acts on the gaps
| Tool | Best For | Rate Data Source | Modes Covered | Update Cadence | Pricing |
|---|---|---|---|---|---|
| Xeneta | Independent ocean and air rate benchmarking | 700+ shippers, 160k+ lanes | Ocean, air | Continuous | Subscription |
| Freehand | Benchmarking your own spend and acting on gaps | Your audited invoices vs market feeds | All modes you ship | Continuous | Custom, volume-based |
| DAT iQ | North American truckload benchmarking | 1,300+ shippers, paid transactions | Truckload (NA) | Daily | Custom |
| FreightWaves SONAR | Multimodal market intelligence | Tenders, ELDs, transactions | Truck, rail, ocean, air | Real-time | Subscription |
| Freightos Terminal | Ocean and air index-grade data | FBX and aggregated sources | Ocean, air | Frequent | Subscription |
| Transporeon | Benchmarking on a large carrier network | Network and market rates | Road, multimodal | Periodic | Custom |
| CLX LaneLogix | Lane benchmarking and bid modeling | Lane rate data | Truckload lanes | Periodic | Custom |
| Cass Transportation Benchmarking | Benchmarking from audited freight data | Cass audited freight bills | Multimodal | Periodic | Custom |
Here is a detailed comparison of the best carrier benchmarking tools: 1. Xeneta, 2. Freehand, 3. DAT iQ, 4. FreightWaves SONAR, 5. Freightos Terminal, 6. Transporeon, 7. CLX LaneLogix, 8. Cass Transportation Benchmarking.
{{blue-cta}}
Xeneta
Best for
Ocean and air shippers that want an independent, continuously updated view of what the market pays, to benchmark contracts and spot rates before and during a bid.
Xeneta is the leading ocean and air freight rate benchmarking platform. It compares your contracted and spot rates against a database of actual rates paid by 700+ global shippers across more than 160,000 port-to-port lanes, giving procurement and logistics teams an independent market view in one place. It is the reference point most enterprise ocean and air teams start from.
Key Features
- Rate benchmarking against 700+ shippers' actual paid rates
- 160,000+ port-to-port ocean and air lanes
- Contracted and spot rate views by lane
- Market trend and service reliability analytics
- Continuous data updates
- Benchmarks for bid preparation and mid-contract checks
- Independent, carrier-neutral dataset
- API access to rate data
Pricing
Subscription, custom by scope. Pricing scales with lanes, modes, and users; expect a sales conversation.
Pros
- The broadest independent ocean and air rate dataset here
- Carrier-neutral benchmarks trusted across enterprise procurement
Cons
- Ocean and air focus, lighter on North American truckload
- A data platform: it shows the market number, you still act on it
What Users Say
- Love: Independent market breadth. Xeneta benchmarks your rates against actual rates paid by 700+ shippers across 160,000+ lanes, the widest independent ocean and air view in this comparison. (source)
- Complain: Data only, thin peer reviews. Xeneta gives you the market number but leaves the comparison and action to your team, and it carries little public G2 review volume, so validate through references. (source)
Freehand
Best for
Enterprises that want to benchmark their actual audited freight spend against the market continuously, and have the above-market lanes flagged and acted on, rather than buying a data subscription and comparing by hand. A strong fit for logistics and finance leaders at $500M+ shippers.
Freehand approaches benchmarking from the opposite end. Its carrier benchmarking and Benchmarking agents evaluate your real invoice and AP data against market feeds and peer cohorts, then surface the lanes and accessorials drifting above market and feed target rates into negotiation and audit. Because it runs on your audited spend at 100% coverage, the benchmark reflects what you actually pay, not a sample, and it acts on the gap instead of leaving it in a dashboard.
Key Features
- Benchmarks your actual audited invoices against market rates
- Carrier Benchmarking and Benchmarking AI Teams across cost and AP metrics
- Surfaces lane-level cost gaps and above-market accessorials
- Feeds target rates into negotiation and audit workflows
- 100% invoice coverage, not a sampled benchmark
- Peer-cohort and internal-trend comparison
- Context Graph unifying contracts, invoices, and market data
- Native connectors for SAP, Oracle, and major ERP and TMS systems
- Acts on gaps through the audit and recovery agents
Pricing
Custom, volume-based. No percentage-of-savings fees. Compare the quote against the analyst time you spend comparing rates by hand, not against a data subscription.
Pros
- Benchmarks your real paid rates, not just market averages to compare manually
- Acts on above-market lanes through audit and negotiation, not a static report
- 100% coverage tied to freight audit and recovery
Cons
- Not an independent market-rate database; it benchmarks your spend against the market and acts on it
- Newer entrant with no public G2 or Gartner benchmarking review profile
- Built for enterprise freight volume, not a lightweight rate-lookup subscription
What Users Say
- Love: Surfaced millions in gaps fast. A Fortune 500 CPG CFO ran continuous benchmarking across freight costs and AP cycles before a board review, instantly highlighting $6.8M in actionable performance gaps. (source)
- Complain: Not a standalone data subscription. Freehand benchmarks your own audited spend against the market rather than selling an independent rate index, and as a newer platform it has no aggregated G2 rating yet, so validate through reference calls. (source)
DAT iQ
Best for
North American truckload shippers and brokers that want the deepest domestic rate benchmarking, built on paid transactions rather than survey data.
DAT iQ is the benchmarking and market-analytics side of DAT, built on a consortium of 1,300+ shippers' paid freight transactions worth $150B annualized and over $1 trillion in total. It delivers lane, carrier, segment, and business-unit benchmarks for North American truckload, backed by more than 20 years of rate data. It is the domestic truckload reference many teams trust.
Key Features
- Benchmarking on 1,300+ shippers' paid transactions
- Lane, carrier, segment, and business-unit benchmarks
- Spot and contract rate visibility
- 20+ years of North American truckload rate history
- Predictive analytics for load planning
- Network performance comparisons
- Daily rate updates
- Analytics dashboards for shippers and brokers
Pricing
Custom, quoted by DAT. Scales with data scope and users.
Pros
- The deepest North American truckload rate dataset here
- Benchmarks built on paid transactions, not surveys
Cons
- North American truckload focus, lighter on global ocean and air
- A data platform: acting on the gaps is left to your team
What Users Say
- Love: Deep domestic truckload data. DAT iQ benchmarks against 1,300+ shippers' paid transactions across two decades, the domestic truckload reference for many logistics teams. (source)
- Complain: Regional and mode limits. Coverage centers on North American truckload, so global ocean and air shippers pair it with another source. (source)
FreightWaves SONAR
Best for
Shippers, brokers, and carriers that want real-time multimodal market intelligence to benchmark rates and service against fast-moving conditions.
FreightWaves SONAR is a freight market-intelligence platform spanning truck, rail, ocean, and air, with much of its data exclusive and drawn from millions of tenders, ELDs, and transactions. Teams use it to benchmark truckload spend and tender acceptance against the market on a lane level and to read demand and capacity shifts as they happen.
Key Features
- Multimodal market data across truck, rail, ocean, and air
- Lane-level benchmarking of spend and tender acceptance
- Real-time rate, demand, and capacity indicators
- Largely exclusive dataset from tenders and ELDs
- Dashboards and visualizations for market trends
- Alerts on shifting market conditions
- Fast time to first insight
- API and export options
Pricing
Subscription, custom by module and users.
Pros
- Real-time, largely exclusive multimodal market data
- Strong for reading capacity and demand shifts quickly
Cons
- Interface has a learning curve for new users
- Some workflows require manual data entry, per reviewers
What Users Say
- Love: Data-backed market snapshots. "It gives a fast, data-backed snapshot of what's actually happening in the freight market instead of just opinions or lagging reports. It pulls from massive amounts of real transaction data and market indicators." (4.6 on G2 across 140 reviews.) (source)
- Complain: Manual input and coverage gaps. "You can't upload the original RFP, you have to manually input everything into their spreadsheet, which adds extra work. Also you can't pull rates for Canadian lanes, which limits its usefulness." (source)
Freightos Terminal
Best for
Ocean and air teams that want index-grade rate data and market benchmarks for pricing, procurement, and internal reporting.
Freightos Terminal is a global supply chain market-intelligence product for ocean and air freight prices and benchmarking. It is home to the Freightos Baltic Index (FBX), the only ocean freight index traded on the Chicago Mercantile Exchange, which gives its benchmarks a financial-grade reference point for volatile ocean lanes.
Key Features
- Ocean and air freight price benchmarking
- Freightos Baltic Index (FBX) reference data
- Rate intelligence for pricing and procurement
- Market benchmarks across major lanes
- Internal reporting and analytics
- Aggregated multi-source rate data
- Trend tracking across volatile lanes
- API access to indices
Pricing
Subscription, custom by scope.
Pros
- Index-grade ocean and air data anchored by the CME-traded FBX
- Strong reference point for volatile ocean pricing
Cons
- Ocean and air focus, not a truckload benchmarking tool
- Market-data product with no dedicated independent review profile
What Users Say
- Love: Index-grade ocean reference. Freightos Terminal is anchored by the Freightos Baltic Index, the only ocean freight index traded on the CME, giving its benchmarks a financial-grade reference. (source)
- Complain: Narrow mode, thin review signal. Coverage centers on ocean and air, and Terminal has no dedicated third-party review profile, so validate fit through references. (source)
Transporeon
Best for
European and multimodal shippers that want rate benchmarking on top of one of the largest carrier networks, alongside procurement and execution.
Transporeon, part of Trimble, pairs a large carrier network with rate management and benchmarking against market rates on top of structured procurement. Teams use it to benchmark and secure competitive rates while running tenders and execution in the same platform, with the deepest coverage across European road freight.
Key Features
- Rate benchmarking against market rates
- One of the largest carrier networks for context
- Rate management and centralized rate database
- Benchmarking alongside tenders and spot auctions
- Coverage across road and multiple modes
- Real-time transport visibility
- SAP, Oracle, and major TMS integrations
- Recognized in Gartner Peer Insights
Pricing
Custom, quoted by modules and network access.
Pros
- Benchmarking tied to a large carrier network and procurement
- Strong European road coverage
Cons
- Coverage and reviews skew to Europe and North America
- UI complexity cited by casual users
What Users Say
- Love: Benchmarking on a deep network. Gartner Peer Insights reviewers (3.6 across the platform) cite real-time updates and rate visibility on one of the widest carrier networks. (source)
- Complain: Regional skew and learning curve. Network depth and reviewer feedback concentrate in Europe and North America, and casual users note a UI learning curve. (source)
CLX LaneLogix
Best for
Truckload shippers that want lane rate benchmarking paired with bid management and scenario modeling to shape lane strategy.
CLX LaneLogix supports transportation management by analyzing and optimizing freight lane strategies. It provides lane rate benchmarking, bid management, and scenario modeling, aimed at teams that want to benchmark a lane and immediately model award scenarios around it rather than pull data into a separate tool.
Key Features
- Lane rate benchmarking
- Bid management workflows
- Scenario modeling for lane awards
- Lane strategy analysis
- Rate comparison across carriers
- Support for truckload procurement
- Analytics for lane decisions
- Integration with transportation workflows
Pricing
Custom, quoted by scope.
Pros
- Lane benchmarking paired with bid and scenario tools
- Fits teams shaping truckload lane strategy
Cons
- Narrower scope than the broad market-data platforms
- No independent third-party review profile to validate
What Users Say
- Love: Benchmark-to-bid in one place. CLX LaneLogix pairs lane rate benchmarking with bid management and scenario modeling, useful for teams shaping truckload lane strategy. (source)
- Complain: Thin independent evidence. LaneLogix has no established third-party review profile and a narrower scope than the market-data platforms, so run a proof of value on your lanes first. (source)
Cass Transportation Benchmarking
Best for
Shippers already using Cass for freight audit and payment that want benchmarking drawn from their own and Cass's audited freight data.
Cass Transportation Benchmarking is a data service built on Cass's audited freight-payment dataset, one of the largest pools of processed US freight bills. It benchmarks your transportation costs against that audited data, which suits shippers already running Cass freight audit and payment who want benchmarking from the same source of truth.
Key Features
- Benchmarking from Cass's audited freight-bill dataset
- Cost comparison by lane and mode
- Tied to Cass freight audit and payment data
- Transportation cost and performance reporting
- Multimodal coverage
- Analytics for cost management
- Reporting for finance and logistics
- Managed data-service delivery
Pricing
Custom, quoted as part of Cass services.
Pros
- Benchmarks from a large pool of audited freight bills
- Consistent with Cass freight audit and payment data
Cons
- A bundled service, not a self-serve rate-intelligence platform
- Thin standalone review signal for the benchmarking service
What Users Say
- Love: Audited-data benchmarking. Cass benchmarking draws on its audited freight-payment dataset, one of the largest pools of processed US freight bills, giving a grounded cost reference. (source)
- Complain: Bundled, not self-serve. Benchmarking comes as a service tied to Cass freight audit and payment rather than a standalone platform, with limited independent review evidence. (source)
Best Carrier Benchmarking Tools Alternatives: Xeneta
If you are evaluating an independent rate-data subscription, the alternative question is what happens after you see the market number.
Freehand
Choose Freehand if the gap is not knowing the market rate but acting on it: benchmarking your actual invoices, catching the lanes paying above market, and recovering the difference. It pairs benchmarking with freight audit and payment software so the gap gets resolved, not just reported.
DAT iQ
Choose DAT iQ if your spend is concentrated in North American truckload and you want the deepest domestic paid-transaction dataset to benchmark against.
Best Carrier Benchmarking Tools Alternatives: DAT iQ
For North American truckload benchmarking, the alternative question is mode breadth versus action.
Freehand
Choose Freehand if you ship across modes and want your own audited spend benchmarked and acted on, rather than a single-mode data feed. Its benchmarking feeds directly into carrier spend management decisions.
FreightWaves SONAR
Choose SONAR if you want real-time multimodal market intelligence to read capacity and demand shifts beyond truckload.
{{brown-cta}}
How to choose the right carrier benchmarking tool
Match the tool to the half of the problem that is costing you money.
- Independent market data: Xeneta for ocean and air, DAT iQ for North American truckload, and SONAR for real-time multimodal market reads.
- Benchmarking your own spend and acting on it: Freehand benchmarks your audited invoices against the market and recovers the above-market gap.
- Lane strategy and bids: CLX LaneLogix and Transporeon pair benchmarking with bid and award workflows.
- Audited-data benchmarking: Cass fits shippers already on Cass freight audit and payment.
Shortlist on whether your gap is knowing the market rate or acting on it, then evaluate each tool against that job. Teams often pair a market-data subscription with freight rate benchmarking built into their audit layer so the benchmark drives recovery.
Frequently asked questions
What are carrier benchmarking tools?
They compare your carrier rates and service against the wider market by lane and mode, so you can tell whether a lane is priced above market and where to renegotiate or recover.
How do carrier benchmarking tools work?
They collect market rate data and your shipment data, score rates and performance by lane and carrier, and compare them against market indices or peer benchmarks to surface gaps.
What is the best carrier benchmarking tool?
It depends on your gap: Xeneta leads independent ocean and air data, DAT iQ North American truckload, and Freehand benchmarks your actual audited spend and acts on the above-market lanes.
How much do carrier benchmarking tools cost?
Most use custom or subscription pricing that scales with lanes, modes, and users. Data subscriptions and spend-based platforms price differently, so compare against the analyst time they save.
What metrics should carrier benchmarking cover?
Look for rate versus market by lane, on-time delivery, claims ratio, accessorial drift, and cost by carrier and business unit, ideally updated frequently rather than annually.
What is the difference between a rate index and benchmarking your own spend?
A rate index shows what the market pays; benchmarking your own spend compares your actual invoices against that market and, in agentic tools, acts on the lanes paying above rate.
How often should you benchmark carrier rates?
Continuously or at least quarterly. Leading shippers use hybrid routing guides that blend fixed contracts with dynamic market benchmarks rather than a single annual bid.
Do carrier benchmarking tools integrate with a TMS or ERP?
Enterprise tools offer API or native connectors into TMS and ERP systems, so benchmarks and target rates flow into procurement, audit, and payment without manual re-entry.
Above-Market Lanes Flagged and Fed Into Negotiation.
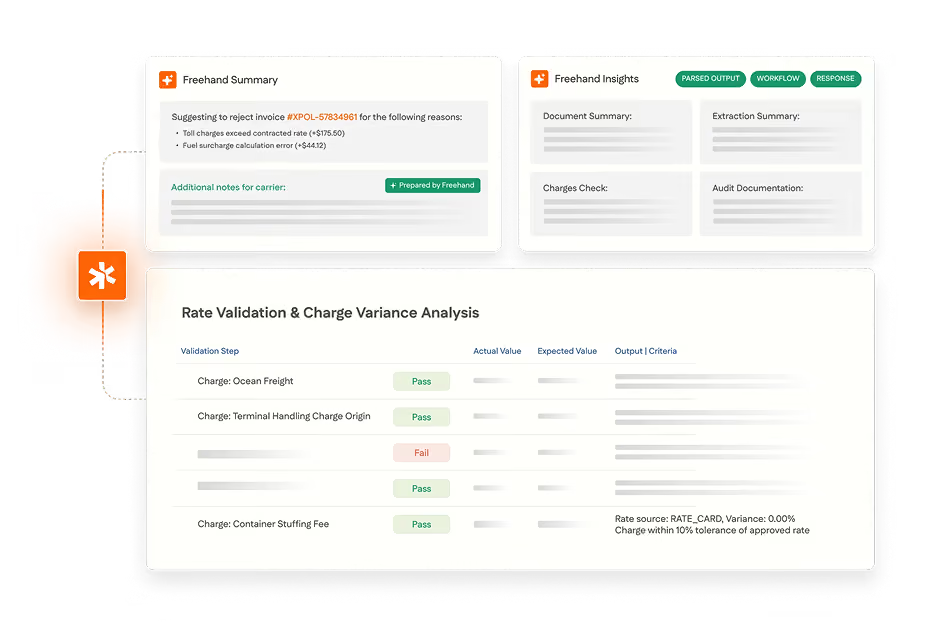
Freehand's Benchmarking agents compare audited invoice data against market feeds continuously and turn the drift into target rates for your next negotiation.
A Rate Benchmark Doesn't Renegotiate Itself.
Most tools show you which lanes are running above market, then leave the follow-up, and the negotiation, entirely on your team.
Every warehouse. Every provider. Every mile.
Gartner's 2026 outlook on logistics outsourcing, and how AI Teams hold every contract to the terms you agreed.
- Where outsourced logistics quietly loses margin
- Why billed charges drift from the contract
- How AI Teams close the gap