

Transportation Spend Management: A Guide for Freight and Finance Teams
.webp)
June 25, 2026
•
11
mins

Transportation spend management is the practice of tracking, auditing, and optimizing freight costs across every carrier, mode, and lane, validating each invoice against contracted rates before payment clears.
It gives finance and logistics teams a verified picture of what they actually paid versus what their contracts required, rather than a picture built from what carriers billed.
Key Takeaways
- Transportation spend management (TSM) is the systematic discipline of consolidating freight data across all modes, auditing carrier invoices for billing accuracy, enforcing contract terms, and using verified spend data to optimize carrier relationships and reduce logistics costs.
- Freight billing errors run in the 3 to 7% range of total freight spend. Most clear AP as normal invoices because no one compared them to contracted rates at the line-item level.
- TSM is not a transportation management system. A TMS manages shipment execution. TSM manages the financial outcome: whether what was billed reflects what was contracted.
- U.S. business logistics costs reached $2.58 trillion in 2024, equal to 8.8% of GDP, making freight one of the largest unmanaged cost categories on most enterprise balance sheets.
- At full invoice coverage, systematic contract-rate enforcement recovers 1.5 to 2.5% of annual freight spend, money that otherwise clears AP without a contract basis.
What Is Transportation Spend Management?
Transportation spend management is the organizational discipline of tracking, auditing, and optimizing transportation costs across every carrier, mode, and lane, converting fragmented freight billing data into verified, actionable spend intelligence.
It is a financial control framework applied to one of the most complex cost lines in enterprise operations. It is not a software category.
Why most freight spend is managed reactively
Most organizations manage that cost line reactively. Invoices arrive from dozens of carriers and run through a standard AP workflow.
The spend data that reaches finance then reflects what carriers billed, not what contracts required. The number on the report is a billing claim, not a verified cost.
What a structured model changes
Transportation spend management replaces that reactive model with three controls:
- Normalize. Freight data is standardized across carriers and modes into one comparable dataset.
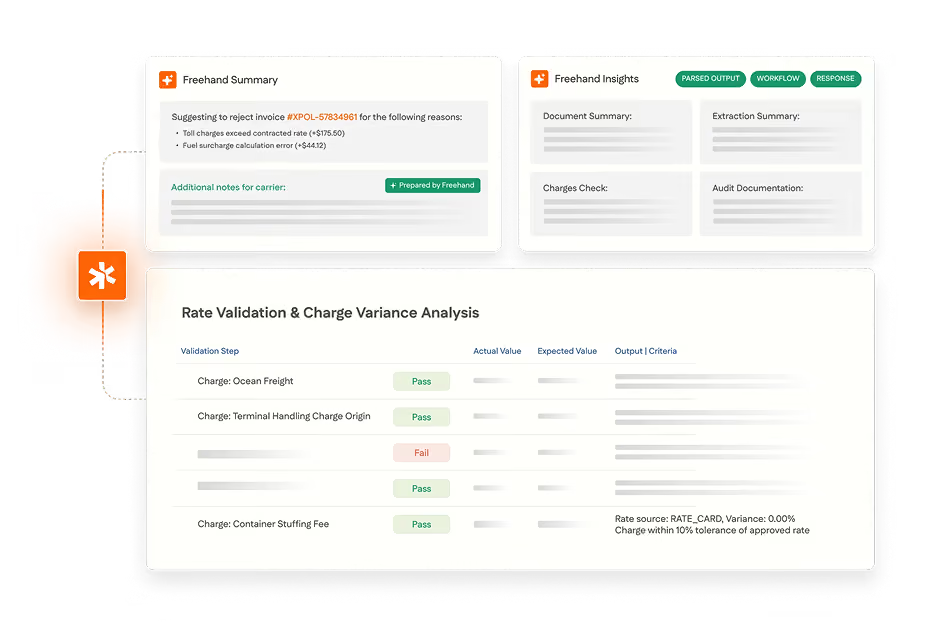
- Validate. Every invoice is checked against contracted rates before payment clears.
- Optimize. Verified spend data feeds carrier reviews, contract renegotiations, and budget forecasts.
The result is a financial picture that reflects what was contractually owed, not what happened to clear AP because nobody checked.
What Is the Difference Between Transportation Spend Management and a TMS?
A transportation management system (TMS) manages shipment execution: route planning, carrier selection, load tendering, and tracking. Transportation spend management manages the financial outcome of that execution: whether what carriers billed reflects what contracts required. Both are necessary, and they do different jobs.
The distinction matters because teams that rely on TMS data for spend visibility are usually working from unaudited numbers.
A TMS records what it was told about a shipment: the carrier, the route, the expected rate. It does not confirm whether:
- the invoice that arrives matches the contracted rate,
- the fuel surcharge was applied at the correct index tier, or
- the accessorial charges have any contract basis.
When unaudited invoices flow straight into TMS reporting, the spend data the TMS produces reflects billing claims, not verified costs.
The practical implication: a TMS tells you how freight moved. Transportation spend management tells you what it cost and whether that cost was correct. Run one without the other and the financial control layer of logistics goes unmanaged.
What Are the Core Components of Transportation Spend Management?
Transportation spend management operates across four sequential components: data normalization, freight audit and payment, carrier contract management, and spend analytics. Each builds on the previous, and removing any one collapses the financial control the discipline is designed to provide.
Data normalization
Before any audit or analysis runs reliably, freight data from every carrier, mode, and region has to be consolidated into a single structure that enables comparison.
Carrier invoices arrive in dozens of formats: EDI 210, carrier-specific PDFs, portal downloads, email attachments, and CSV exports. Surcharge labels vary too. A charge one carrier calls "OHC" is "origin handling" at another and bundled into base linehaul at a third.
A normalization layer maps carrier-specific terminology to a consistent charge taxonomy and consolidates records across modes into one dataset. This is the prerequisite for everything that follows, not an optional enhancement. Feed a TMS unnormalized, unaudited invoices and its spend reports reflect billing inconsistency rather than actual cost.
Freight audit and payment
With normalized data in place, every invoice line is compared against the contracted rate for that carrier, lane, charge type, and billing date before payment is approved. This is where the freight audit and payment function lives.
Billing errors in the 3 to 7% range do not announce themselves:
- A fuel surcharge applied at the carrier's published general rate rather than the contracted indexed formula looks like a legitimate fuel surcharge.
- An accessorial charge at the correct rate on a delivery that never triggered the required condition looks like a legitimate accessorial charge.
Both pass standard AP review. Both fail contract-rate validation. Pre-payment audit at full coverage catches them before the money leaves, and preserves the full dispute window on every error found.
Carrier contract management
Verified audit data is the evidentiary foundation for carrier negotiations. A team entering a renewal with documented billing error rates by carrier and charge type, lane-level rate history, and current market benchmarks negotiates from a stronger position than one relying on impressions and prior-year reports built from unaudited invoices.
Contract management also covers the enforcement gap. When rates are amended, the updated terms need to reach the invoice validation layer before the next billing cycle, not weeks later. The lag between amendment and system update is where negotiated savings evaporate before they reach the P&L.
Spend analytics and optimization
With verified invoice data in place, spend analytics drives operational decisions rather than just reporting. Lane-level analysis surfaces which routes run above contract, which carriers bill above the agreed schedule, and where mode shift could cut cost without hurting service.
This is the layer a spend analytics capability is built to serve. At this granularity it feeds the next sourcing cycle, the annual budget, and carrier performance reviews with numbers that were validated rather than assumed accurate.
What Are the Key Drivers of Transportation Spend?
Transportation costs are driven by four structural factors: carrier contract terms, fuel and surcharge structures, accessorial charges, and mode and lane decisions. Each is manageable with the right data. None is manageable without it.
Carrier contract terms
The carrier contract sets the cost floor for every shipment on every contracted lane. Terms that go unreviewed tend to drift in the carrier's favor through three mechanisms:
- annual escalation clauses that embed rate increases automatically,
- vague accessorial definitions carriers interpret to their billing advantage, and
- minimum volume commitments that lock shippers into pricing tiers that no longer fit their profile.
Without benchmark data, most teams cannot say whether their rates are competitive or simply the rates their carrier preferred to offer. Lane-level freight rate benchmarking, informed by audit data, is what closes that gap.
Fuel and surcharge structures
Fuel surcharges are a large and volatile share of freight cost. In most contracts the formula is indexed to weekly diesel prices published by the EIA, stepping up or down by tier as the index moves.
The exposure is structural. A carrier applying surcharges at its published general-rate index rather than the contracted formula generates a systematic overcharge across every invoice in every affected lane. The per-invoice amount may be modest. Across a high-volume relationship over a year, the aggregate is material.
{{blue-cta}}
Accessorial charges
Accessorial charges are the highest-error category in freight billing. Residential delivery fees, detention, liftgate charges, address-correction fees, and fuel adjustments apply conditionally, based on service events. The question is not only whether the rate is correct, but whether the triggering condition actually occurred.
A residential delivery fee billed at the contracted rate on a commercial address passes validation at the rate level. It fails at the triggering-condition level. Catching it requires shipment data confirming the address classification, which is why accessorial validation needs TMS integration, not contract-rate matching alone.
Mode and lane decisions
Mode and routing choices set the cost baseline before any invoice exists:
- A shipment moved by air because the LTL booking window was missed costs four to six times the surface rate.
- A shipment routed through a sub-optimal gateway adds cost no audit can recover, because it was correct at the contracted rate for the chosen mode.
At the optimization layer, transportation spend management identifies lanes where mode shift would cut cost without hurting service, and flags spot-freight patterns that signal routing-guide non-compliance before they compound across quarters.
What Does a Transportation Spend Management Problem Look Like in Practice?
Consider a food distributor operating across 12 U.S. facilities, shipping with 42 active carriers across LTL, FTL, and parcel. Monthly freight spend runs $2.4M.
Invoices arrive in EDI, PDF, and portal formats. The AP team runs a standard three-way match against purchase orders and delivery confirmations. Clean matches clear in 48 hours; exceptions queue for manual review. The spend data reaching finance reflects what carriers billed. Nobody has compared it to contracted rates at the line-item level.
Over four quarters, three patterns stay invisible to the finance and logistics team:
None of these surface in the standard AP workflow. All three are systematic patterns a transportation spend management program with full audit coverage identifies inside the first billing cycle.
Total recoverable: $241,820 a year. On $28.8M in annual freight spend, that is 0.84% recovered from three charge categories alone, before any rate benchmarking or contract renegotiation.
What Are the Challenges of Transportation Spend Management?
The structural challenges are data fragmentation, invoice-level billing complexity, amendment lag, and the disconnect between execution systems and financial-control systems. Each creates a specific leakage pattern that compounds every cycle it goes unresolved.
Fragmented data across carriers and modes.
An enterprise with 30 active carriers receives invoices in formats specific to each billing system. Skip normalization and spend reports aggregate billing claims from incompatible formats, making lane-level and carrier-level comparisons unreliable.
Billing complexity at the line level.
A single invoice can carry six or more charge types, each governed by a different contractual mechanism: linehaul tied to a lane price, fuel tied to a weekly index, accessorials tied to operational events, adjustments tied to shipment characteristics at delivery. Standard AP matching validates the format, not the mechanism behind each line.
Amendment lag between contract and enforcement.
A renegotiation closed in early Q2 but not loaded into the validation system until mid-Q2 means six weeks of invoices validate against pre-amendment rates. The savings are contractually real and financially absent until enforcement catches up.
The TMS data reliability gap.
A TMS fed unaudited invoice data produces analytics built on billing claims. The lane-level cost data that informs routing, carrier selection, and RFP benchmarking then optimizes against the wrong baseline. Clean audit data is the prerequisite; the two systems need to work in sequence, not in parallel with unverified data flowing between them.
What Does Good Transportation Spend Management Look Like?
Good transportation spend management is measurable: it moves audit coverage, error detection, and enforcement speed from the reactive baseline most enterprises run today to a verified target state. The gap between the two columns below is where freight margin leaks.
What Are the Best Practices for Transportation Spend Management?
The best practices all address the same compounding failure modes: unverified data feeding financial reporting, coverage gaps that let systematic errors accumulate, and contract terms negotiated but never enforced at the invoice level.
Audit every invoice before payment, not after.
Pre-payment audit prevents overcharges from clearing and preserves the full dispute window. Full coverage requires infrastructure that handles every carrier format, validates line by line, and routes exceptions before the payment run. Selective sampling produces coverage on the invoices least likely to contain errors.
Normalize data before drawing conclusions.
Lane comparisons, carrier benchmarking, and mode analysis all require a unified dataset. Insights from unnormalized multi-carrier data reflect format inconsistency as much as real cost difference. Normalization is infrastructure work, and it has to be in place first.
Connect audit findings to contract negotiation.
A carrier with a documented pattern of fuel surcharge misapplication across three quarters is a different counterpart at renewal than one with a clean record. Feed findings into performance reviews as bargaining power, not one-cycle recovery events.
Benchmark rates against current market data.
Carrier spend management needs an external reference point: current market rates for similar lanes, volumes, and modes, set against contracted rates. Benchmarking turns the question from "is our rate better than last year's?" into "is our rate better than what the market offers today?"
Integrate spend data with the ERP.
When validated invoice data posts to the ERP with a full audit trace, month-end close reflects what was actually paid under contracted terms. When unaudited invoices post directly, finance books billing claims and reconciles the difference later, which is where the monthly reconciliation queue originates.
How Does Freehand Deliver Transportation Spend Management?
Most transportation spend management programs run three disconnected workstreams: a TMS for execution, a freight audit process for invoice review, and a spend analytics tool for reporting.
Data moves between them imperfectly. Audit findings reach the analytics layer days or weeks late. Contract amendments reach the audit layer after billing cycles have already run against expired terms.
One connected system, not three workstreams
Freehand's freight audit and logistics finance platform runs transportation spend management as a single flow:
- Ingest. Every carrier invoice across every mode is normalized and validated against contracted rates before payment clears.
- Enforce. The audit layer holds current rates for every carrier and lane, updated with each amendment on its effective date.
- Verify triggers. TMS shipment data confirms accessorial conditions, and fuel surcharges are checked against the EIA weekly diesel index.
- Resolve. When a charge fails validation, Freehand's AI Teams compile a dispute packet and submit it to the carrier autonomously, rather than just flagging it.
- Post actuals. Validated numbers post to the ERP with a full audit trace, so spend analytics reads from verified data.
What it covers
Freehand handles parcel, LTL, FTL, ocean (FCL/LCL), air, intermodal, rail, and last mile, with native integrations for SAP, Oracle, Dynamics, JDE, and NetSuite.
The approach is recognized in the 2026 Gartner Market Guide for Freight Audit and Payment Providers, and it arrives as the category shifts toward autonomous software: Gartner projects supply chain software with agentic AI will reach $53B by 2030.
What it recovers
For enterprises managing $15M or more in annual freight spend, Freehand recovers 1.5 to 2.5% of freight spend a year through contract-rate enforcement at full invoice coverage. The spend analytics that follow are built from verified actuals, not carrier billing claims.
Request a demo to see what transportation spend management looks like when audit and analytics run from the same verified data foundation.
{{brown-cta}}
Frequently Asked Questions
What is transportation spend management?
The end-to-end process of consolidating freight data across all carriers and modes, auditing invoices against contracted rates before payment, enforcing carrier contract terms, and using verified spend data to optimize costs and negotiate better contracts.
What is the difference between TSM and a TMS?
A TMS manages shipment execution: routing, carrier selection, and tracking. Transportation spend management manages the financial outcome: whether what carriers billed reflects contracted terms. A TMS fed unaudited invoices reports billing claims, not verified costs.
How much can transportation spend management save?
Freight billing errors affect 3 to 7% of total freight spend. Systematic audit at full coverage recovers 1.5 to 2.5% annually. On $30M in annual freight spend, that is $450,000 to $750,000 a year in charges billed without a contract basis.
What are the main components of transportation spend management?
Data normalization across carrier formats, freight audit and payment validating every invoice against contracted rates, carrier contract management enforcing terms after signature, and spend analytics using verified data to drive optimization.
Why do freight billing errors go undetected without TSM?
Because they look like legitimate invoices. A fuel surcharge at the wrong index tier and an accessorial on a delivery that never triggered the condition both pass standard AP review. Catching them requires comparing each charge to the contracted rate and confirming the trigger occurred.
Related Reading
When you drill past the total spend line, most of the recoverable money sits in the invoice detail. Our deep dive on freight spend analysis shows how charge-level review surfaces the overbilling that summary reporting hides.
The same discipline applies once you separate spend by relationship. If most of your volume runs through a handful of providers, our guide to carrier spend management covers how to hold each carrier to contracted rates instead of accepting the invoice as filed.
Freight is rarely the only category leaking margin. For the broader view across modes and departments, our piece on supply chain spend management connects transportation spend to the rest of the cost base.
Every Invoice Validated Against Contract Rate, Not Just Logged.
Freehand audits every carrier invoice against your contracted terms across every mode and lane, closing the gap a TMS alone can't.
Your TMS Shows Cost. It Doesn't Show Whether the Cost Was Correct.
A transportation management system tracks what carriers billed. It doesn't check that against what your contract required.
Every warehouse. Every provider. Every mile.
Gartner's 2026 outlook on logistics outsourcing, and how AI Teams hold every contract to the terms you agreed.
- Where outsourced logistics quietly loses margin
- Why billed charges drift from the contract
- How AI Teams close the gap
.png)